Lesson 6
Minimax objectives & working with graphs
I. Time minimization problem
Download the Lesson6_SolvingTimes.mos Mosel model from hereThere are 6 students (Alex, Bianca, Charlie, Diana, Erica & Felix) that have to solve 20 problems as fast as possible. They want to minimize the final finish time. Each problem takes some amount of time to solve (which is the same for each student). These are listed in the lengths array.
Notice that the objective function takes the form $$\min \left( \max_{s \in \text{ STUDENTS}} \sum_{p \in \text{ PROBLEMS}} \text{solve}(s,p)\ \text{lengths}(p)\right)$$ Which is a non-linear objective function. We call this a "minimax optimization problem".
II. Minimax objective functions
Minimax modelling theorem
Let \(a \in \mathbb{R}^n, x \in X \subseteq \mathbb{R}^n, b \in \mathbb{R}, x\) is unkown, then $$\min \left( \max_{x \in X} a^T x + b\right) \Leftrightarrow \begin{cases}&\min t \\ &\forall{x \in X}\quad t \ge a^T x + b\end{cases}$$Maximin modelling theorem
Let \(a \in \mathbb{R}^n, x \in X \subseteq \mathbb{R}^n, b \in \mathbb{R}, x\) is unkown, then $$\max \left( \min_{x \in X} a^T x + b\right) \Leftrightarrow \begin{cases}&\max t \\ &\forall{x \in X}\quad t \le a^T x + b\end{cases}$$III. Minimax modelling exercise
A machinery company wants to build CPUs. Once built, the CPU will be officially rated, and given a quality rating ranging from terrible to excellent. The quality of the product is the quality of the worst material included. Below, you can see what materials will be needed and the price (in USD) of each material depending on its quality:| Prices per quality | Steel | Aluminum | Silicon | Copper | Cobalt | Chrome | Nickel |
|---|---|---|---|---|---|---|---|
| terrible | 10 | 2.0 | 0.3 | 4.3 | 16 | 21 | 8 |
| awful | 20 | 3.0 | 0.5 | 4.4 | 19 | 24 | 12 |
| poor | 24 | 3.5 | 0.9 | 4.5 | 20 | 25 | 16 |
| rough | 29 | 4.1 | 1.7 | 4.6 | 23 | 26 | 19 |
| below average | 35 | 4.9 | 3.0 | 6.1 | 25 | 33 | 22 |
| average | 37 | 7.5 | 3.4 | 6.8 | 29 | 37 | 23 |
| above average | 38 | 7.8 | 3.9 | 7.6 | 34 | 38 | 25 |
| decent | 44 | 8.0 | 4.5 | 8.1 | 39 | 40 | 26 |
| good | 59 | 8.1 | 7.2 | 8.5 | 40 | 41 | 27 |
| great | 75 | 8.2 | 10.4 | 10.8 | 41 | 46 | 29 |
| high | 82 | 8.5 | 15.9 | 12.9 | 45 | 47 | 30 |
| excellent | 117 | 10.2 | 20.8 | 13.0 | 46 | 49 | 33 |
The company wants to create the highest quality CPU possible, with a given budget per CPU. The following scenarios are to be modelled: The budget is 100, 125, 150, 175, 200, 225, 250, 275, or 300 USD per CPU constructed.
III./1. Exercise 1
a) Start a new Mosel file. Declare ranges; as well as variables for which quality will be bought for which material.b) Copy the table above into Mosel.
c) Write up the objective function. We would like to maximize all qualities (or in other words, maximize the minimum of the qualities).
d) Linearize the maximin objective function.
e) Set the starting budget to 100 USD, and calculate a basis solution.
f) Calculate the solution with the following starting budgets: 100, 125, 150, 175, 200, 225, 250, 275, 300 USD.
g) Draw a graph of the quality levels of the final product per each starting budget.
IV. Modelling graphs
A museum director must decide how many guards should be employed to control a new wing. Budget cuts have forced him to station guards at each door, guarding two rooms at once. Formulate an LP to minimize the number of guards.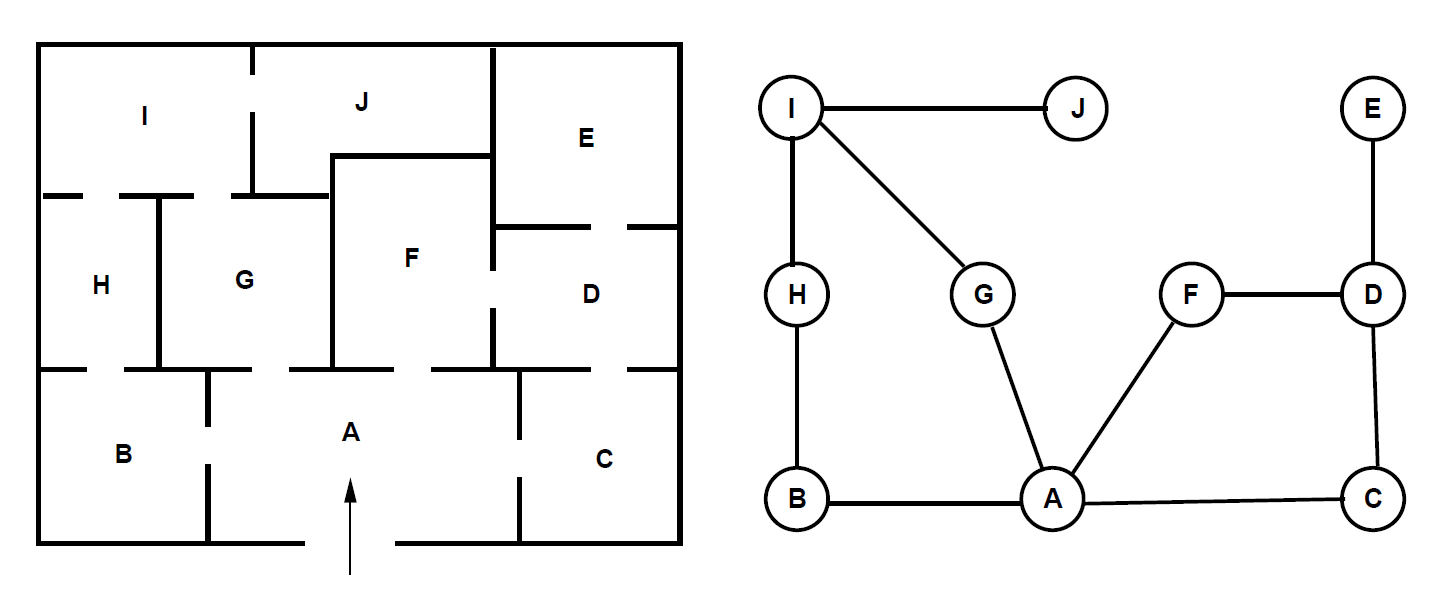
Download the Lesson6_MuseumGuards.mos Mosel model from here
IV./1. Exercise 2
a) Run the program and understand the constraints!b) What is the difference between the following constraints? Which one did we include in the model and why?
forall(i in V | sum(j in V) E(i,j) >= 1 ) do
sum(j in V) guardSpots(i,j) + sum(j in V) guardSpots(j,i) >= 1
end-do
forall(i in V) do
sum(j in V | E(i,j)=1 ) guardSpots(i,j) + sum(j in V | E(j,i)=1 ) guardSpots(j,i) >= 1
end-do
c) What is the difference between the current objective function and
OBJ:=sum(i in V, j in V) guardSpots(i,j)*E(i,j)
IV./2. Initializing arrays from a data file
Solve the problem for the following museum layout as well, by importing the file below!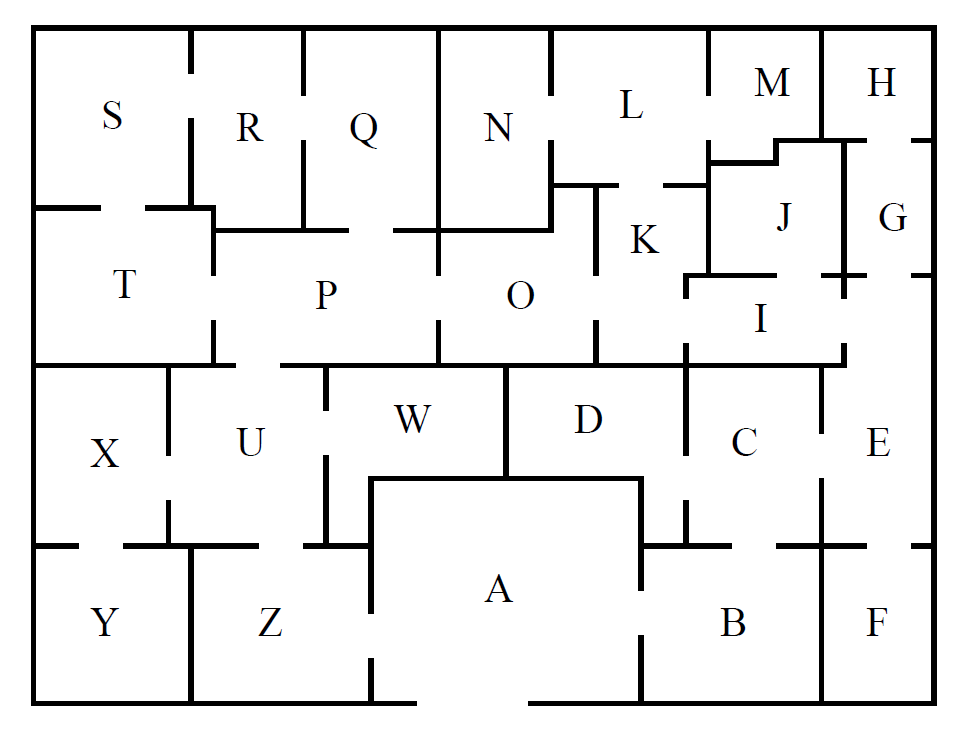
Download the MuseumGraph.dat data file from here
Put the data file in the same folder as your Mosel file!
IV./3. Exercise 3
a) Change the V set toV={"A","B","C","D","E","F","G","H","I","J","K","L","M","N","O","P","Q","R","S","T","U","W","X","Y","Z"}
b) Use the following code to initialize the new graph instead:
initialisations from "MuseumGraph.dat"
E
end-initialisations